
Granbury Live is a small music venue located in the heart of Granbury, TX — right on the historic downtown square.
Though their site brings in tens of thousands of visits per month from both locals and visitors, their old website’s age was starting to show after putting in 5 years of hard work.
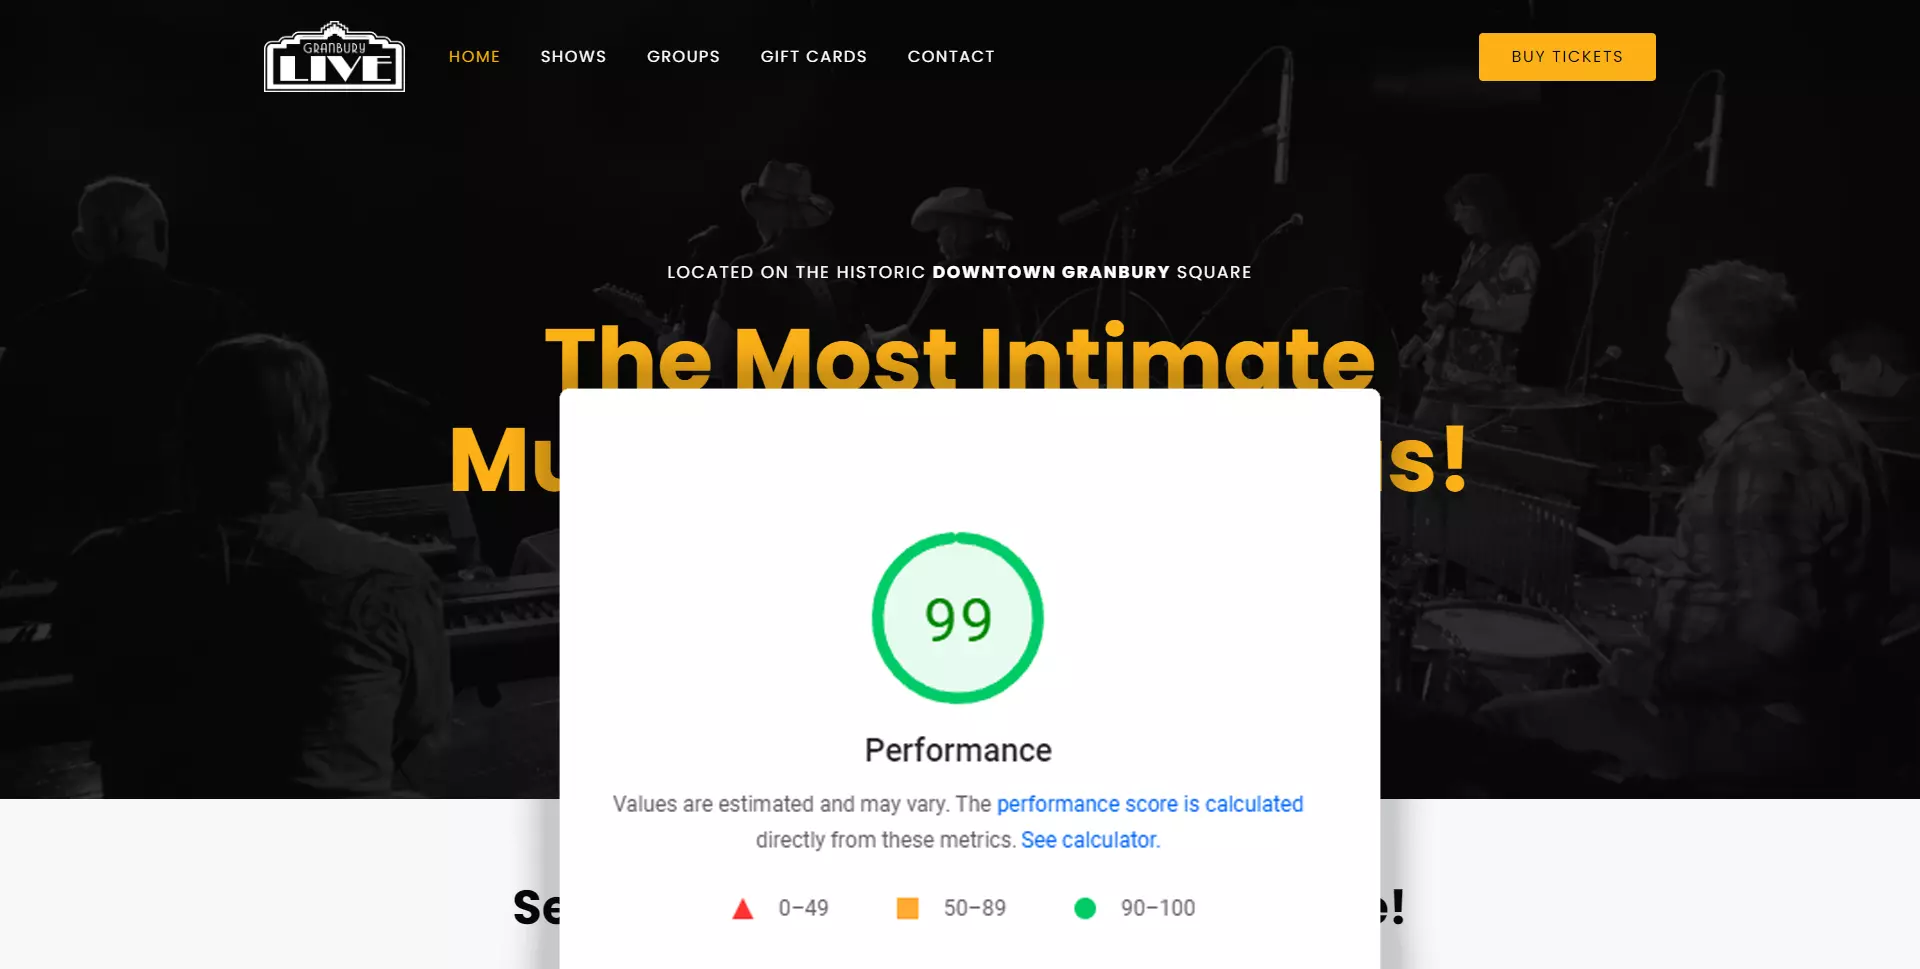
In July of 2022, I completely overhauled the Granbury Live website with an entirely new tech stack to improve performance, accessibility, SEO, and best practices. The result? We managed to take the site from a mid-50s PageSpeed score all the way to a 99! Ready to find out how I did it?


In this case study, we’re going to dive into how the website rebuild completely transformed Granbury Live’s metrics across all measurable categories (and a few immeasurable ones too).
The Problems
Over time, every website begins to show signs of wear and tear — and the Granbury Live website was no different.
Although it was still functioning without any major issues, new performance and accessibility standards have been put in place since it first launched; most noticeably Core Web Vitals, which has become a key ranking factor in Google’s algorithm.
The biggest challenge in improving the website’s performance was its original architecture: the page builder Elementor.
There are only so many things you can do to mask the poor performance of a foundational tool like Elementor, so the only way to truly improve the website’s performance was to rebuild with better tools.
A Better Foundation
A website is only as good as the software powering it — and the old software (Elementor) leaves a lot to be desired.
For the rebuild, everything was built from the ground up using GeneratePress (theme) and GenerateBlocks (plugin) to make the website completely built with the WordPress Block Editor (a.k.a. Gutenberg).
I recently switched over to using blocks for all my new website builds and am currently in the process of rebuilding all my old Elementor websites with blocks — including this one.
The WordPress Block Editor is extremely lightweight, allowing for fantastic performance scores right out of the box (without any heavy caching and manipulation); it gives you the full range of design possibilities (when paired with GenerateBlocks); and it makes the website easy to maintain and edit, even for novice users (like many of my clients).
This combination of traits makes Gutenberg the clear winner when it comes to building a high-performing website.
Performance Improvements
Website performance was one of the top considerations in this website rebuild, so we’ll spend most of our time talking about the improvements made in this area.
Typically, for performance testing, I use a combination of three tools to measure performance:
- Lighthouse (via Web.dev)
- PageSpeed Insights (by Google)
- GTMetrics
This combination of tests gives me a wide range of data to examine and ensure that my websites are performing well on every possible metric.
Let’s take a look at the before and after scores on all three of these platforms.
Lighthouse Testing
Lighthouse tests give you a combination of performance, accessibility, best practices, and SEO scores. For now, we’ll just focus on the performance side of things.
The old site was getting an overall score of 56 out of a possible 100 — which results in a failing grade.
There was a myriad of reasons for the poor score, including:
- A poor First Contentful Paint score of 1.9s
- A poor Speed Index score of 3.7s
- A horrific Largest Contentful Paint score of 5.4s
- And a dismal Time to Interactive score of 8.4s
Reasons for these poor scores include:
- Serving images in legacy formats
- Unused JavaScript
- Unused CSS
- Render-blocking resources
- Slow server response time
- An inefficient caching policy
You can see all of the details here:

No user today will accept waiting 8.4 seconds until they can interact with a website.
However, the diagnostics on the new site tell a different story.
First contentful paint went from 1.9 seconds to 1.1. Speed index went from 3.7 seconds to 1.1 seconds. Largest contentful paint came down to 2.1 seconds from 5.4. And the biggest change was the time to interactive, which is now at 1.1 seconds (down from 8.4 seconds).

The new site is shaving a full 7.3 seconds of the entire load time, which should give a significant boost to user experience.
It’s important to note that the lighthouse tests are completed on the mobile website, since most traffic today comes from mobile devices (and in Granbury Live’s case, mobile views account for 73% of their traffic). Mobile scores are typically harder to achieve than desktop scores, and a 99% performance score puts this site in rare company since 50% of the top 100 websites in the world fail core web vitals performance standards.
PageSpeed Insights Testing
While I do like Lighthouse scores for the additional tests they provide beyond performance, when it comes to search engine optimization, what really matters is what Google thinks.
And while Google doesn’t let us too far into their black box when it comes to how their algorithm works, they have provided us with a PageSpeed Insights test which mimics how Google measures website performance.
Prior to the rebuild, the PageSpeed Insights (or “PSI”) score for Granbury Live was a pathetic 46% out of a possible 100.

The only metric of the 6 measured with a passing score was the Cumulative Layout Shift.
In today’s standards, this website does not meet expectations in any meaningful way.
Thankfully, the rebuild tells a different story with PSI tests too: boosting it from a 46 to a 98.

The new site now passes all 6 of Google’s metrics with the following scores:
- First Contentful Paint: 1.4s
- Time to Interactive: 1.4s
- Speed Index: 1.4s
- Total Blocking Time: 0ms
- Largest Contentful Paint: 2.1s
- Cumulative Layout Shift: 0.028
These dramatic increases have put Granbury Live’s mobile PageSpeed scores among the best performing websites on the internet.
GTMetrics Performance Testing
The last of the testing tools we’ll examine is GTMetrics.
Though GTMetrics has made improvements to their testing algorithm, they tend to be less reliable on the overall scores. However, they provide much more detail when we get into the nitty-gritty details.
There are a few things that are worth examining when it comes to GTMetrics.
Speed Visualization
GTMetrics speed visualization tool shows you a simple timeline of how your page loads, with timestamps at each landmark.
With this chart, you can visually see where all the metrics like Time to First Byte, First Contentful Paint, and Fully Loaded Time fall. What’s interesting to note when comparing the before and after is how much the scale of the visualization changed. On the old website the scale went all the way up to 2.5 seconds, but on the new site, it never reaches 1 full second.


By the time the old site received its first byte of information, the new site is completely interactive, and only a split second later (45ms) the entire site is loaded. That’s an increase of nearly 2.5 times in total load time!
Page Details
Another important factor when it comes to performance is both the Total Page Size and the Total Page Requests. GTMetrics provides these scores as well — and you won’t be surprised to learn that both have made a dramatic improvement.
The website rebuild took the Total Page Size from 2.4MB to 317KB (an 87% decrease), and the Total Page Requests from 76 to 12 (an 84% decrease)!


Making the website a whole lot lighter, and with fewer requests, is one of the major factors in making the website’s performance scores improve so dramatically. And while not directly related to performance, a lighter website also means the new website has a dramatically smaller carbon footprint.
GTMetric’s waterfall chat gives a great visualization of the reduction in requests to load the website:


Fewer requests not only mean that the website loads faster, but it’s less taxing on the website server and user’s data plan. While these may look like random numbers on a chart, these represent measurable cost savings for both the website owner and visitor (not to mention the environmental impact too).
Accessibility Improvements
While the accessibility issues on the old website weren’t nearly as concerning as the performance, there is always room to make websites more accessible!
Since I rebuilt the entire site from scratch, I could make accessibility improvements to the templates, individual pages, and posts.
First, I made sure we’re using the company’s color palette effectively. Yellow is a very difficult color to implement effectively when it comes to color contrast standards. All of the website buttons and links were put through accessibility tests to ensure they adhere to a 4.5:1 color contrast ratio, which makes them high-contrast enough to be clearly visible.
Thankfully the GeneratePress theme makes things a lot easier when it comes to accessibility. The site features a skip navigation link, a fully accessible menu (on both desktop and mobile), and proper landmarks for the content.
We did have to correct a few issues to ensure that heading elements would always be in the correct order, which can be a challenge when you’re using a mix of both static and dynamic content inside of templates (which most of this website is based upon).

Though no testing tool can accurately test all accessibility factors, Lighthouse is giving the new site a 100% score, and I’ve meticulously combed through the website with an accessibility checklist to make all the improvements I could find. This is especially important as the primary audience of Granbury Live is 60+ years of age, which is a demographic more prone to vision challenges.
Design Improvements
While the site, for the most part, retained its original design (if it ain’t broke, don’t fix it!), I did make some minor tweaks to improve the user experience.
Upcoming Show Cards
One of the primary functions of the website is for users to browse all of the upcoming shows. The old cards that displayed all the shows were small, and lacked important details someone would need to make their mind up about attending.
The new cards feature a full-width design that includes the show date, ticket information, performer name, a small subheading, and the performer image.

Show Postings
The individual posts that display all the show details also got a minor facelift, adding a faded image in the background (specific to each performer) which adds more visual interest to the page.

What’s nice about this system is that it uses dynamic content to pull in the background photo making the entire process nearly automatic.
Custom Photography
One of the last design improvements that was made on the new website was to include more photography of the theater.

Locals will instantly recognize this iconic building on the square (the only one like it in Granbury!), but featuring the unique architecture should also increase travelers interest in visiting this one-of-a-kind theater.
Wrapping Up
Website performance can have a dramatic effect on some of the most important metrics of your website:
- It affects user experience by making pages load quicker.
- It improves SEO by showing search engines your website is worthy of traffic.
- It results in measurable cost savings.
- It reduces the environmental impact of your online presence.
Across all metrics, the Granbury Live website has made massive strides in improving its performance, putting it in the top echelon of websites on the internet today when it comes to performance.
A rebuild with blocks not only improved the site’s performance but gave us an opportunity to improve accessibility and design while we were at it.
This work has set the Granbury Live website up for success for years into the future, insuring they can continue to delight guests in the most intimate music venue in Texas!


