I’m excited. I’m moving all of my clients to a guilt-free web analytics software. One that presents powerful insights in a clear, straightforward dashboard. One that doesn’t spy on consumers to gather information. I’m talking about Fathom Analytics, and I outlined the reasons for my move away from Google Analytics in favor of Fathom.
I’m excited, and you should be, too! Fathom Analytics is a great Google Analytics alternative. It offers all of the insights of Google Analytics in a simpler and easier-to-understand dashboard with none of the uncomfortable guilt-by-association misgivings of using Google. Plus, it’s GDPR-compliant, so you aren’t in breach of data privacy laws, no matter where your visitors may be viewing your website.
You can unlock a staggering amount of information about who is visiting your site, what they’re looking at, and how they got there in the first place with Fathom. I’ve outlined below a few of the data measurements I’ll be using in Fathom Analytics to inform search engine optimization and web design for my clients.
Visitors & Views
When you view website analytics, it’s helpful to know a little of the lingo. “Visitors” are the people who come to your website. “Views” are the number of times visitors accessed your website.
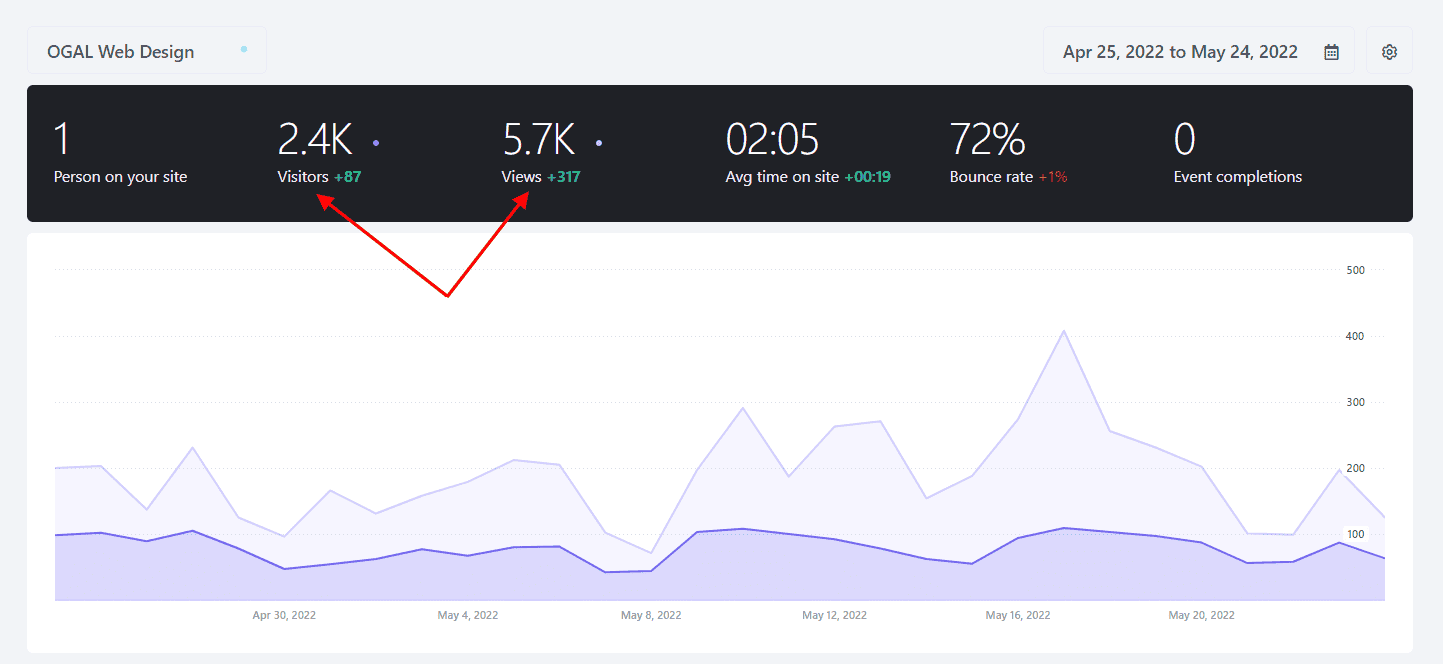
So one visitor may generate several views if they return to your website again and again. It’s important to know how many visitors you have, and of course, you hope that number is high.
But it’s equally important to know how many times a visitor views your website. If you have a high number of visitors, but no one returns for another view, you may need to change your website design or content to resonate more with your visitors. Or you may need to think harder about whether you’re attracting the right visitors in the first place.
Filtering by Date Ranges
The ability to filter by date ranges means you can track visits to your website through seasons or monitor the success of specific campaigns. For instance, if you boosted a Facebook post for a particular two week period, you can track how that boost may have increased your website visits during that period by filtering by the date range.
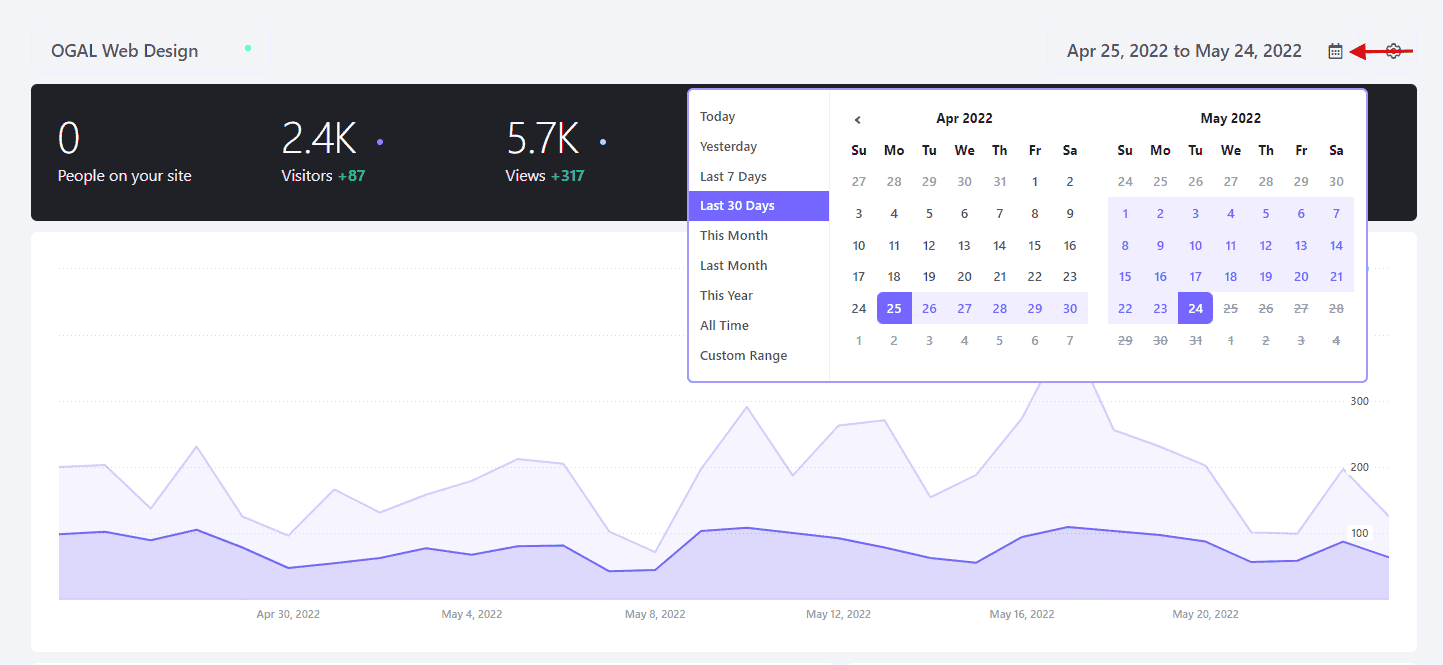
You can also compare date ranges to one another. So, you may want to view a three-month range, say, the Christmas season, of 2021 versus 2020. Or you may want to compare the traffic before a specific email marketing campaign versus after it. Filtering by data can give you exciting data to correlate your digital marketing efforts to increases in website visits.
Average Time on Page
It’s great to get a high volume of visitors to your website. But if your visitors don’t stay on your website, they won’t be of much use to you.
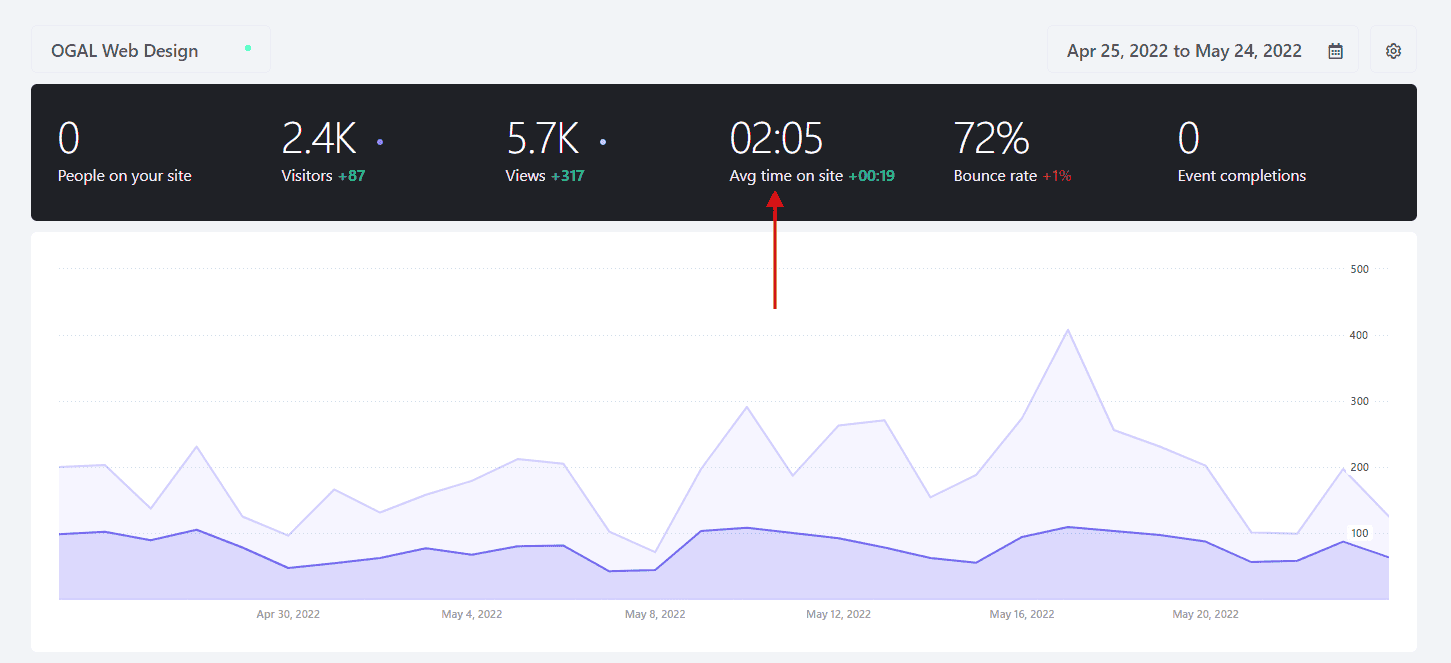
Visitors who stay longer are more likely to convert to sales or clients, so inspecting your “average time on page” data will give you insight into which pages are interesting to your leads and which pages could use some content love.
Bounce Rate
Your bounce rate is the percentage of your website visitors who land on your website and then immediately leave without clicking on any links or visiting any other pages. Like the “average time on page,” it’s a good indicator of whether visitors find the information or products they want on your website. It can tell you whether people want to stick around and find out more about your products/services when they land on your website or whether they want to “bounce” off of it as soon as they land.
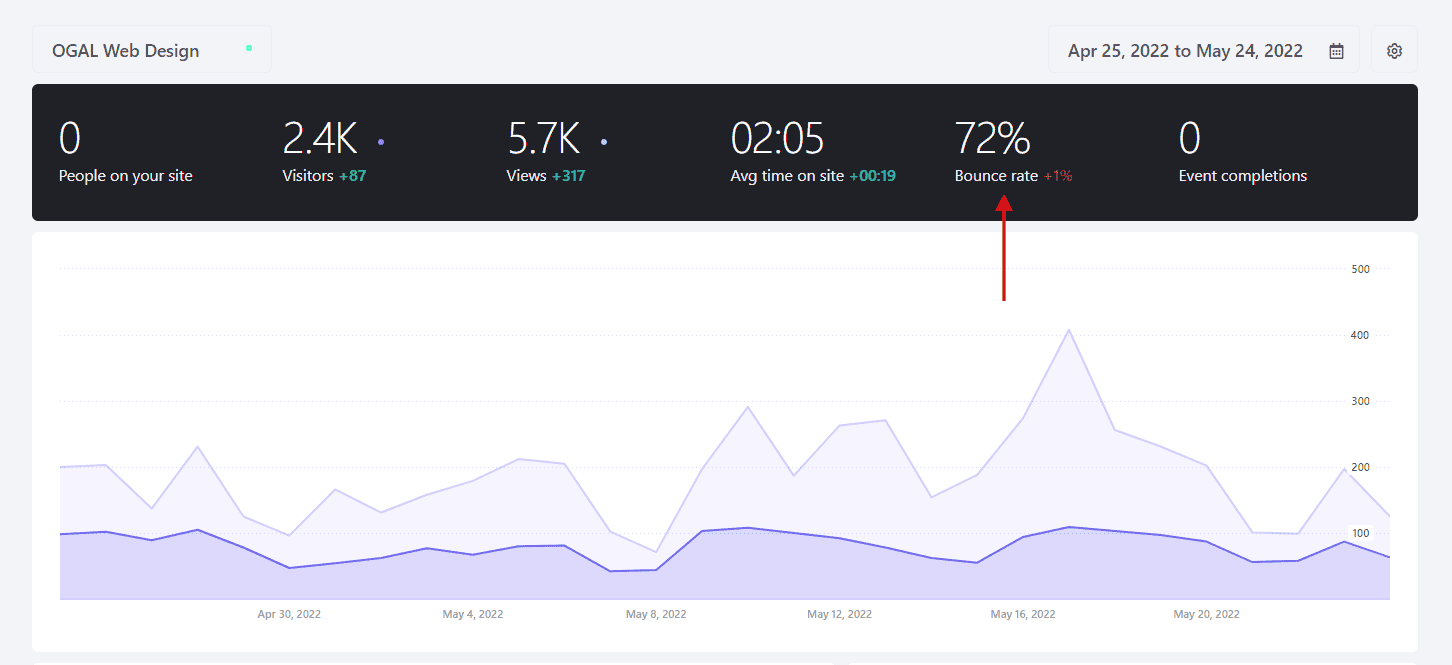
It’s such a good indicator of whether a website contains valuable and relevant content that search engines use it as part of their search algorithm. Websites with a high bounce rate indicate to search engines that visitors will not find what they want on that website for the keyword they searched. So, in combination with other measurements, the search engine will stop recommending that website in the search results.
Events
An “event” is anything that your visitors do on your website. When they click a button or a link, submit a form, or watch a video, those are all events. Events data is powerful because it tells you which website features are getting the most attention. It’s great to see that certain website elements perform their role and trigger the event they are supposed to trigger.

But if there’s an element of your website that doesn’t trigger any events – a button that’s never clicked, a product that’s never added to a basket, a newsletter signup form that’s never submitted – it’s worth evaluating whether that element needs to be redesigned or maybe even removed entirely.
Content
The content section is one of the most important sections of your Fathom analytics dashboard as it shows you which of your pages are the most popular. Along with the page URL (address), it will also show you several other important metrics.
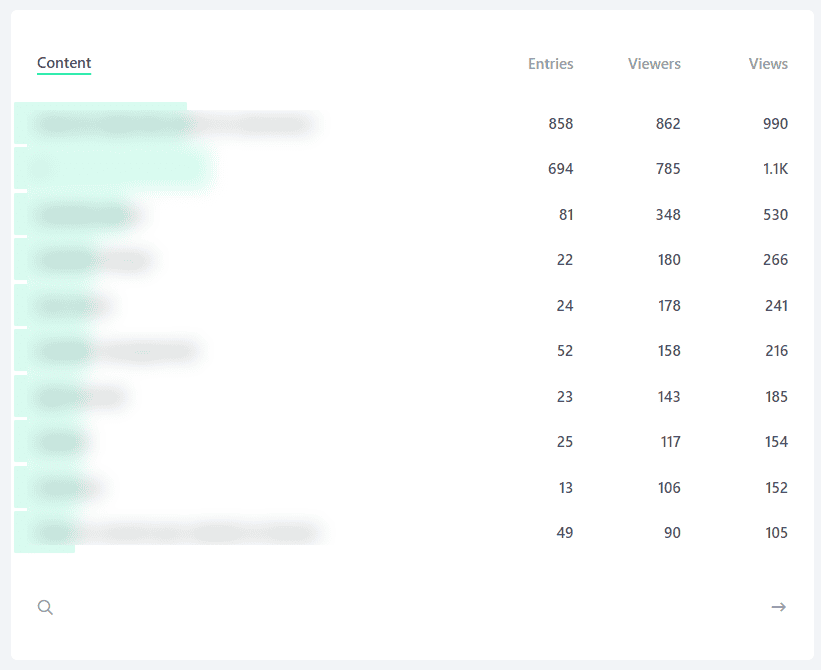
Entries is the number of people who came to your website through this page. Often your home page (marked with a single “/” in the dashboard) will be the most common entry point for people — but not always. Popular blog articles can often be the best entry point for your website.
Viewers are the number of people who have visited that page, while views is the number of times the pages has been viewed. The slight difference being one viewer could visit a page multiple times — so the views number will always be equal to or larger than the viewers number.
Referrers
Knowing where your visitors come from is vital for analyzing which of your digital marketing channels is most productive for you. In Fathom Analytics, the “referrer” is the website on which your visitor clicked the link to your website.
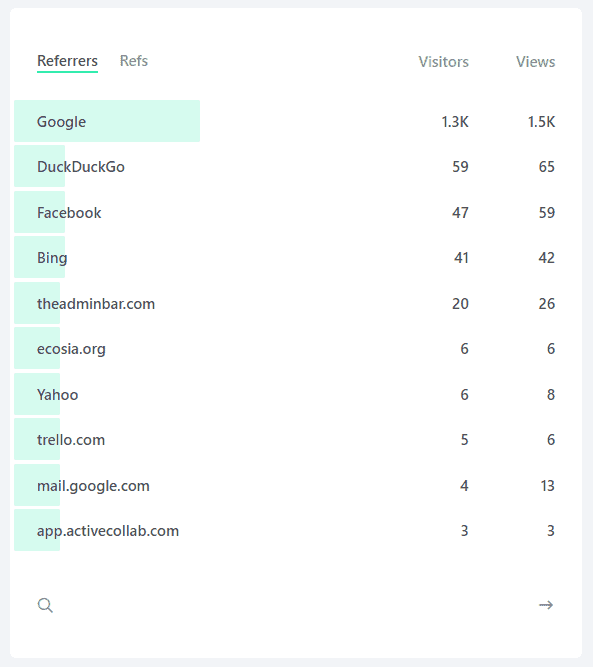
In Fathom, you can filter by referrer and by another filter, such as the page that they visited, at the same time. So you can see who visited your Contact page from DuckDuckGo, or who visited your Services page from Instagram. This can be handy if you’re running PPC advertising campaigns and want to measure whether visitors are finding your site as a result of those campaigns.
Device Types, Browsers, and Countries
Knowing the device type your visitors use can help you build a better website experience for them. For instance, you may have designed with a desktop experience in mind. But if you notice that most of your visitors are using mobile devices, you may need to rethink your website design to make mobile navigation and purchases clear and simple. Likewise, you may find that your visitors prefer a browser that your website design doesn’t support well.

If you see that you get lots of visitors from countries outside the US, you may want to try to appeal to them by offering free or reduced international shipping or office hours that would suit their time zone. It’s just another metric that helps you tailor your website to meet the needs of your visitors and entices them to convert to sales.
Are you getting excited, too?
Website analytics can be pretty addicting. It’s just so powerful to know who is visiting your website, where they’re coming from, and what they do when they get there. And it’s a relief to know that the information you’re using has been ethically sourced.
Fathom Analytics has made a helpful video explaining its features and dashboard, which you can find here:
I really recommend this software, and I’m happy to talk to you about how to use Fathom’s insights to build a data-driven, conversion-focused website for your business. Fill out my (very brief!) contact form, and we can set up a time to talk.
