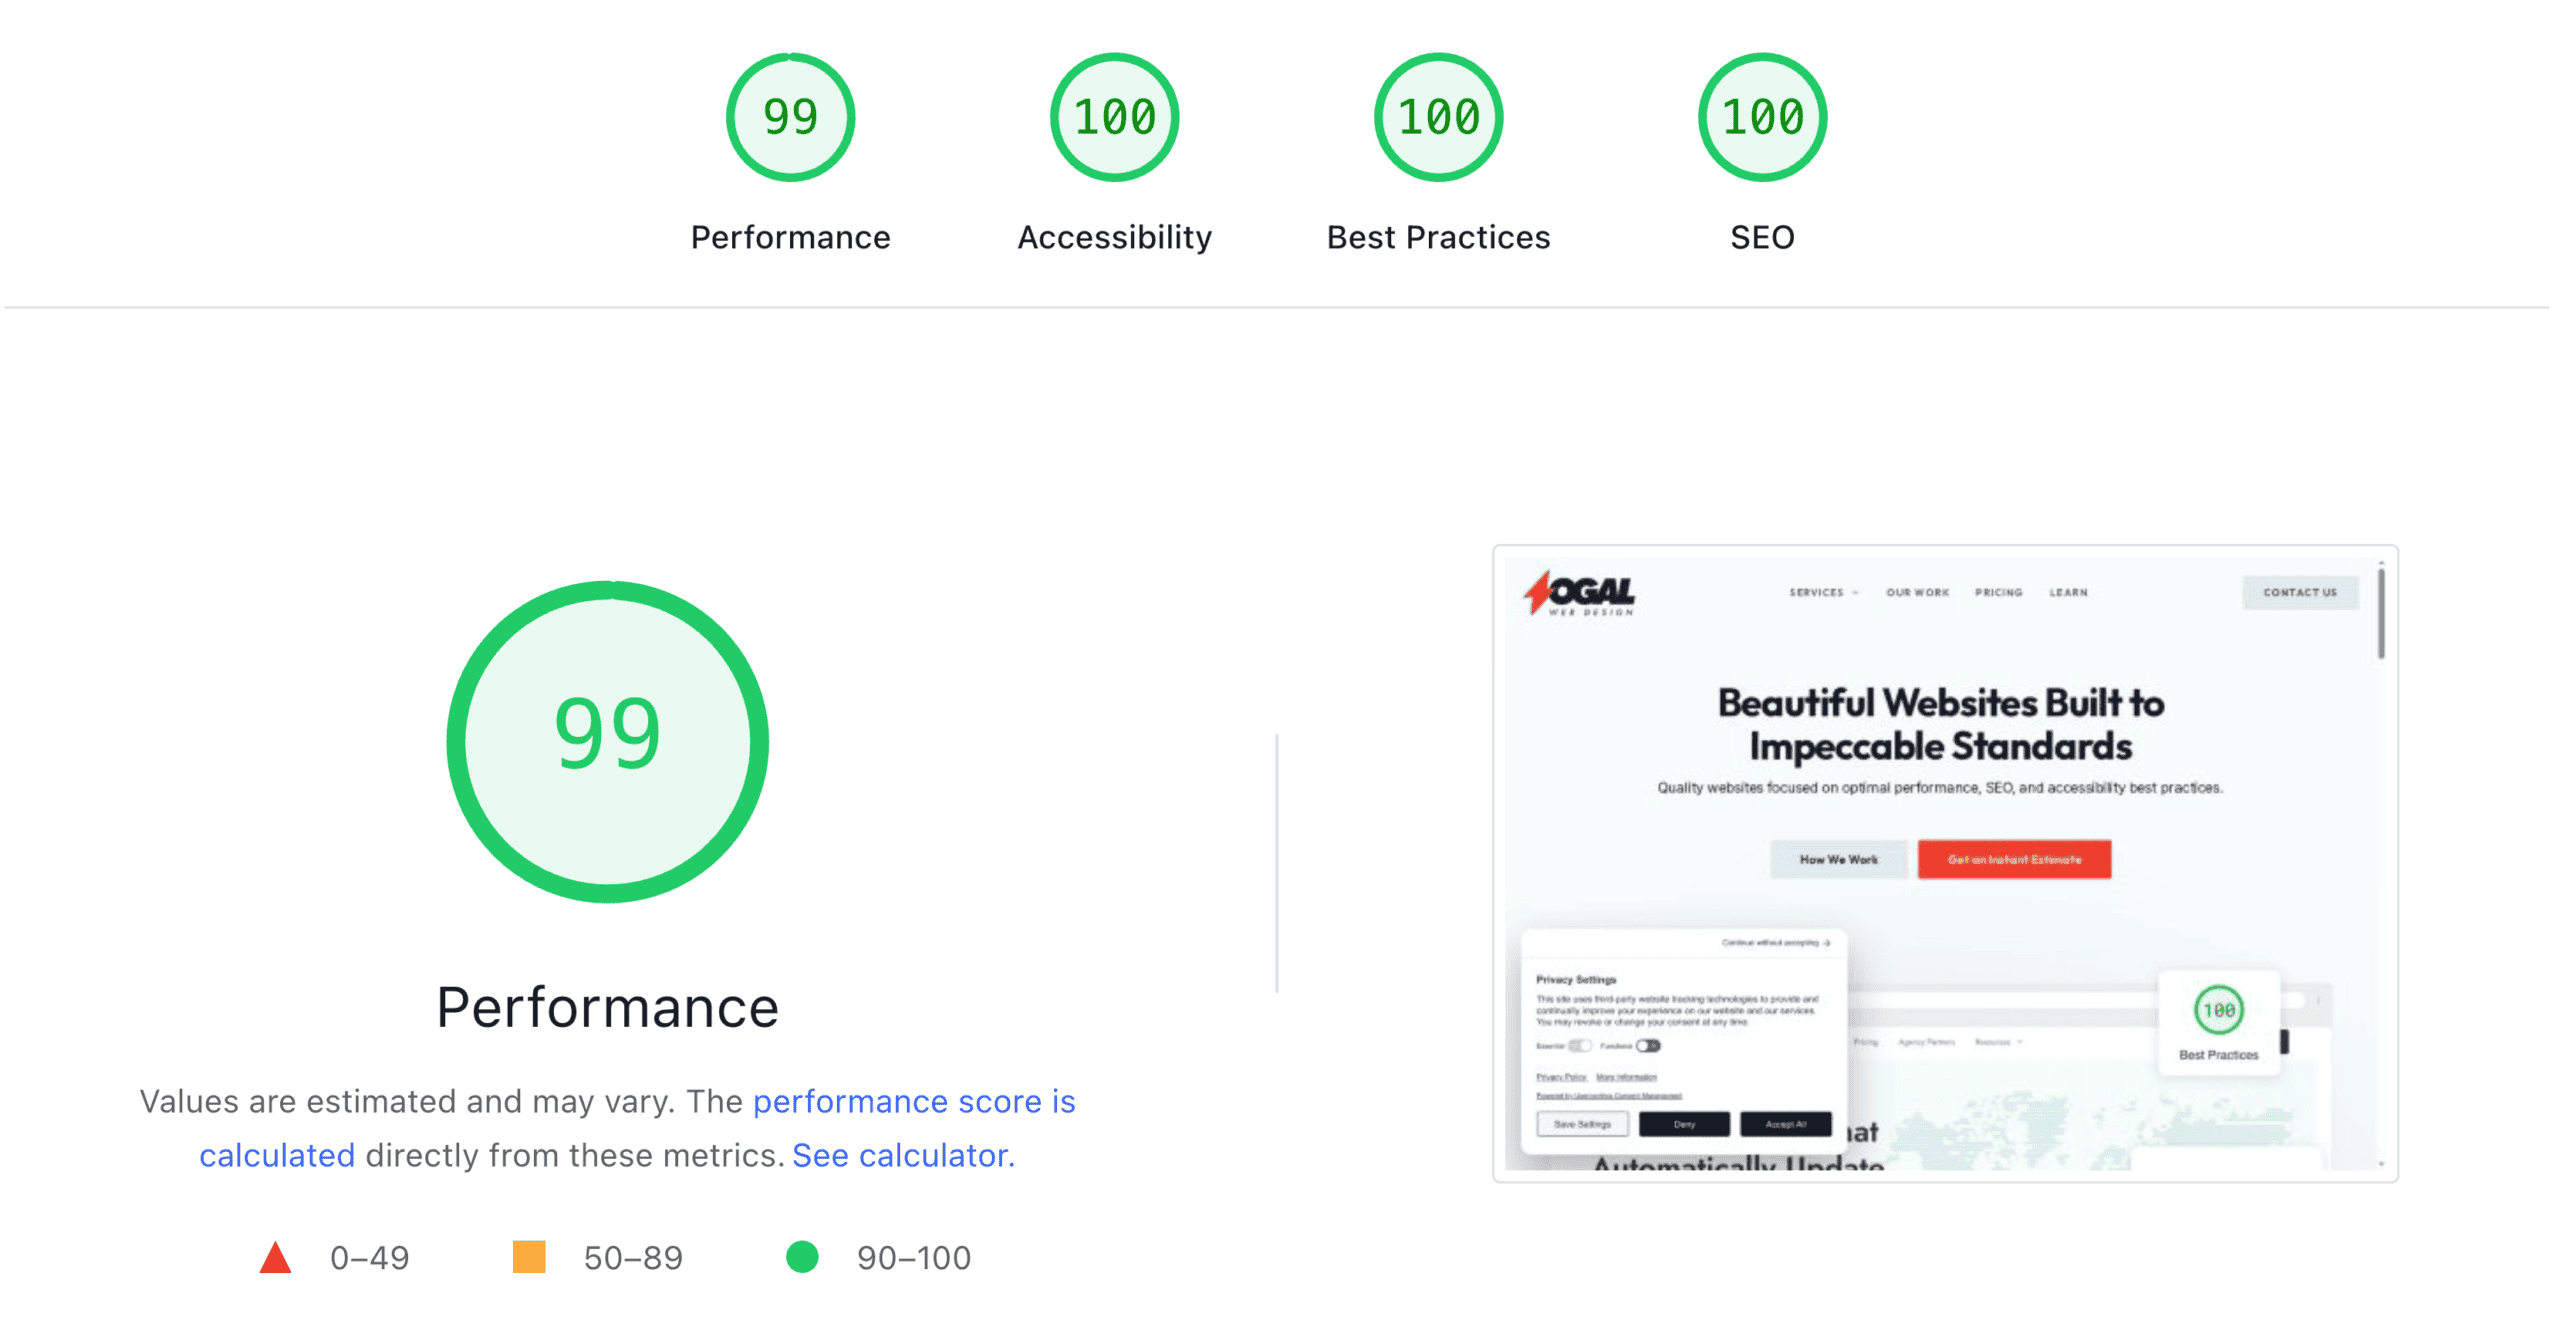
I’m a bit of a performance nut — in most cases it probably goes beyond practicality — but as a naturally competitive person, there’s nothing I love more than beating my high score.
Performance is a major reason why I use the block editor and GenerateBlocks — both of which offer amazing results out of the box, while other page builders make you work extra hard to fix all their bloated code.
We’ve spent a lot of time talking about performance tools, like Perfmatters, that help solve performance issues — but today I thought we’d talk about how to audit website performance and figure out what’s causing the slow loading times in the first place.
You might be more impressed if I told you about the 12 tools I use to maximize my results — but truth be told, I can typically get everything figured out with just two tools.
And, in my opinion, the fewer tools we can use, the easier this process will be.
If you’re struggling to pinpoint what’s holding your website back, then stick around and learn about the tools I use and how I use them.
Core Web Vitals v. Lighthouse
When it comes to measuring website performance, there are a lot of things to consider… But what I’m primarily focused on are core web vitals.
Why? Because that’s what Google cares about.
They’ve constructed this system to specifically make websites optimized for visitors and bundled it into their algorithm to have some effect on ranking.
So by passing core web vitals, you’re killing two birds with one stone; you have a site that’s been optimized for visitors and improved your SEO all at one time.
So — how do you test Core Web Vitals?
Before we dive into that, I think we actually have to first clear up an area around this that’s a bit confusing…
The Difference Between Lighthouse Tests and Core Web Vitals
What you’ll see a lot of people do — myself included — when testing performance metrics is run a Lighthouse test.
But Core Web Vitals and Lighthouse tests work a little bit differently.
Core Web Vitals use real-world data. They capture metrics from actual user experiences — and this is what plays into your search rankings.
On the other hand, Lighthouse tests simulate the average experience with bots — you’ll often hear this referred to as “lab data”.
What will make the biggest difference is passing Core Web Vitals — so why even mess with Lighthouse tests?
There are a few reasons why Lighthouse tests play a critical role in improving your core web vitals.
First, since CWV uses real-world data, if you’re developing a brand new site — you don’t have any real-world data. Google wants hundreds or thousands of unique visitors in order to determine CWV, and a brand new website that’s not indexed — or running locally on your machine — simply doesn’t have the data.
But even if you’re working on a live website with plenty of traffic, as you make optimizations you’re not going to see an immediate change to your Core Web Vitals scores. Those scores are an average of tons of user data that could take weeks or even months to adjust.
Lighthouse tests can be manually prompted and simulated instantly — meaning you can see what kind of effects your changes have in nearly real time.
Keep in mind that Lighthouse doesn’t test the exact same things as Core Web Vitals, as it’s only a simulation, and Core Web Vitals can actually measure user behavior that can’t be simulated in tests. This can make a difference — but for most people, and without splitting hairs, what Lighthouse does is close enough to CWV it shouldn’t make a practical difference.
How to Test Website Performance
Alright, now that we understand the difference between how Core Web Vitals and Lighthouse work, let’s talk about how we can test either of them.
PageSpeed Insights Testing
There are many ways you can do this, but what I’ve found the easiest for everyone is to use the web.dev tool.
From here, it’s pretty simple:
- Type your domain into the search bar
- Press search
- Get the results
PageSpeed Insights will give you both the Lighthouse lab tests, plus the actual Core Web Vitals scores — assuming you have enough traffic.
If you don’t see the Core Web Vitals scores, it’s because there was not enough data on the URL you tested, and instead, you’ll only see the lab/lighthouse testing.
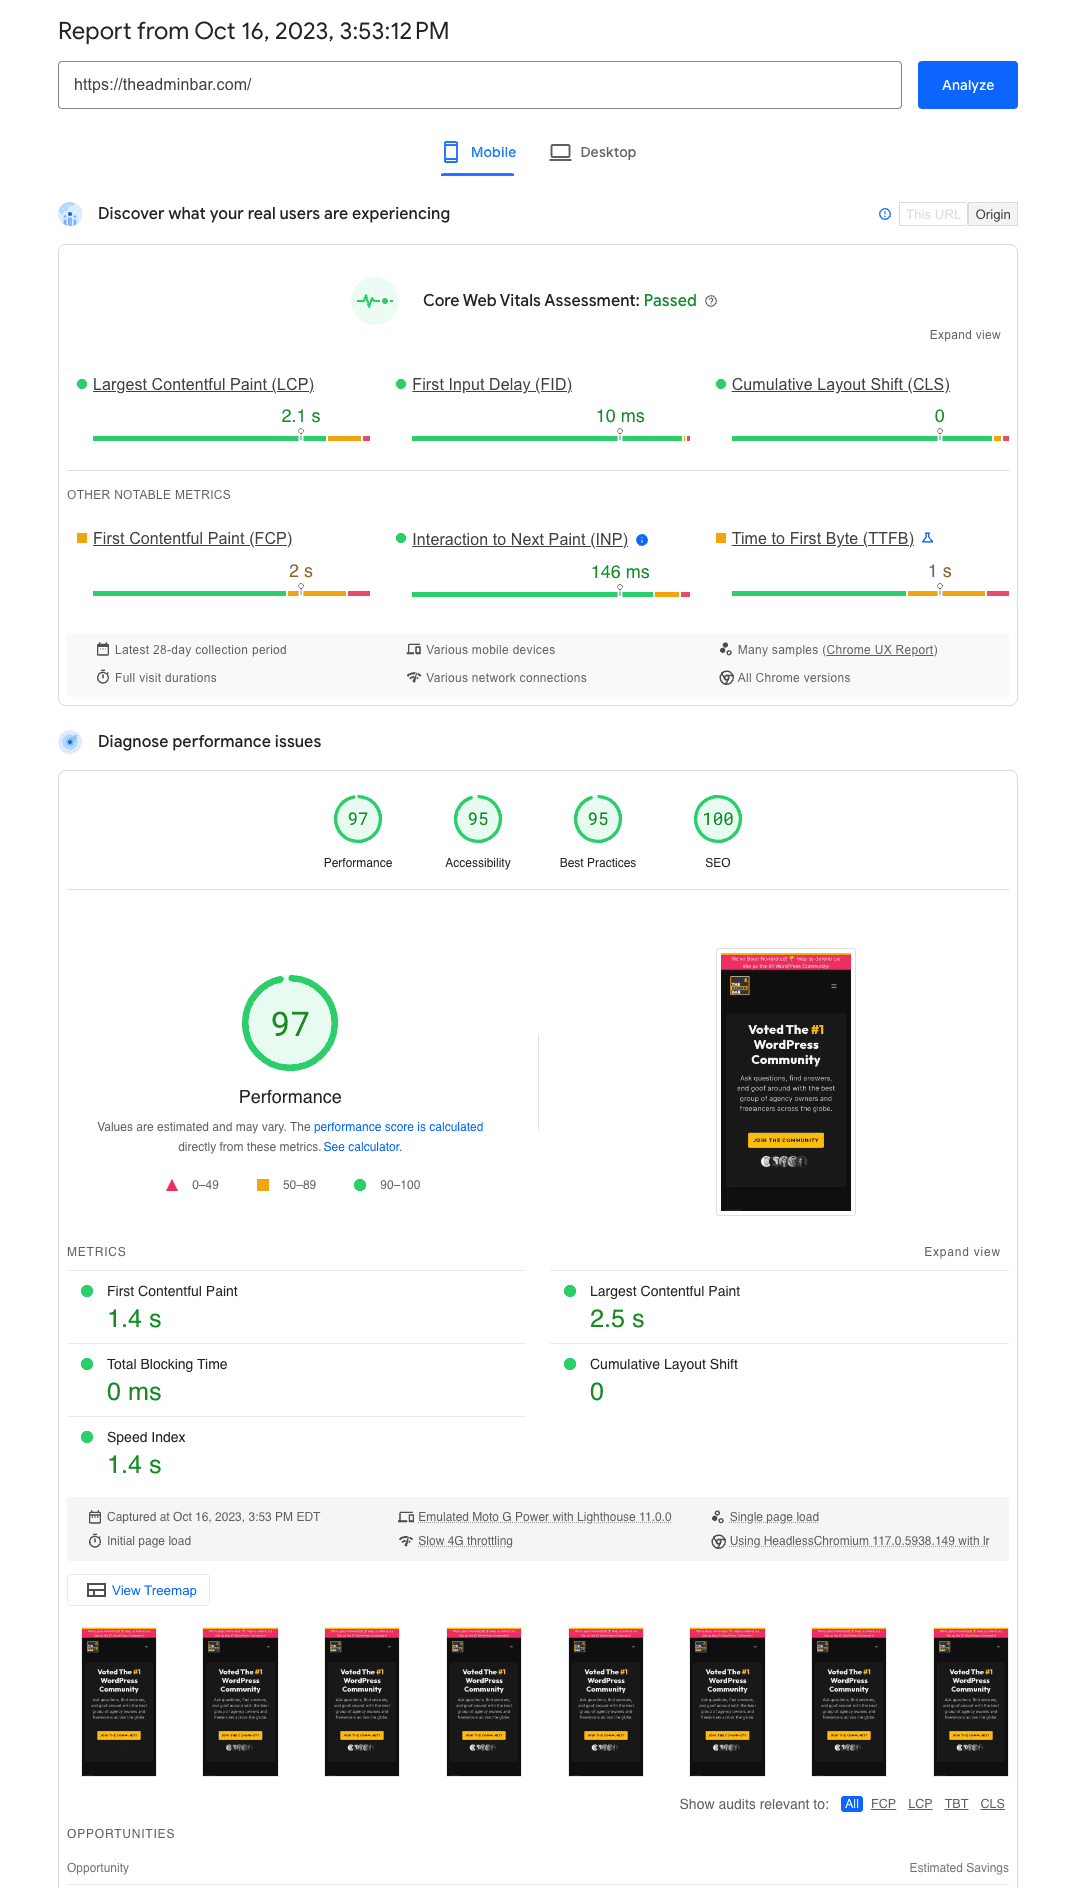
Your Core Web Vitals assessment will show you the 3 primary criteria of Largest Contentful Paint, First Input Delay, and Cumulative Layouts Shift along with 3 more metrics; First Contentful Paint, Interaction to Next Paint, and Time to First Byte.
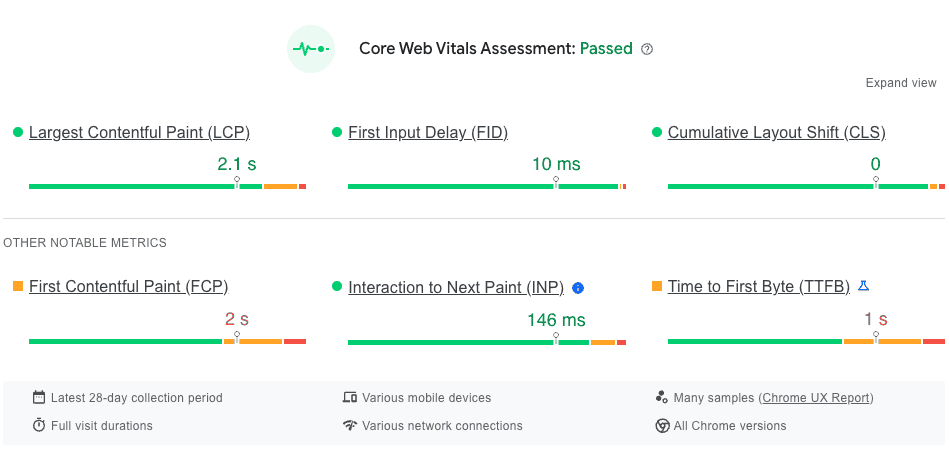
You’ll be able to see how your site did on a sliding scale for each of these tests.
By default it’s going to show you the mobile scores, but you can open the Desktop tab to see your desktop scores. However, I rarely do that, as if you’re doing well on mobile, then you’re probably doing great on desktop.
Underneath the CWV data you can see the Lighthouse lab data.
Lighthouse also tests other metrics like accessibility, best practices, and SEO. All of those can be useful, but we’re going to skip over them for the purposes of this article.
Under performance, you’ll see scores for First Contentful Paint, Largest Contentful Paint, Total Blocking Time, Cumulative Layout Shift, and Speed Index — some of these you’ll already have seen inside your CWV data, and some are slightly different.
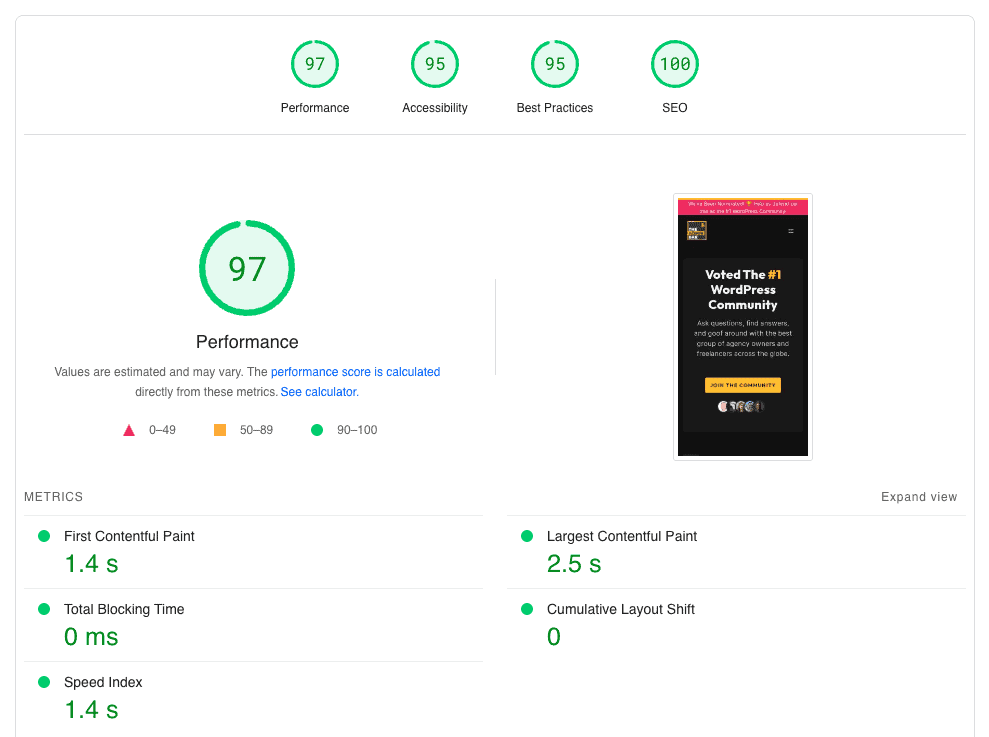
The purpose of this article is just to talk about how to test things, so we won’t go into debugging the issues these tests find, but it’s important to look under your Lighthouse report where it will show you the diagnostics and opportunities, which all give you a quick definition, show specifics, and a link to more detailed information.
It can be overwhelming, especially at first, but there is a lot of great information here and as you do this more and more, you’ll rely on these extra resources less.
Using GTMetrix Testing
That pretty much covers everything I wanted to share about my first tool, PageSpeed Insights, so let’s move on to our next.
The other tool I use to audit and diagnose performance issues is GTMetrix.
Though GTMetrix will also try and simulate Core Web Vitals scores, I find Lighthouse and PageSpeed Insights to be much more accurate.
However, GTMetrix has some great data that Lighthouse doesn’t give you.
Let’s run a GTMetrix report, so you can learn how to use it, and I’ll point out the pieces of data I find most helpful.
When you go to GTMetrix.com you can simply drop your URL into the search field and hit “analyze”.
However, I would recommend first signing up for a free account for two reasons…
First, by signing up for a free account, you can actually change the testing center where the data is coming from. By default, GTMetrix is set to test from Vancouver, Canada — but that could be oceans away from your server.
When you sign up for a free account, you’re able to test from Hong Kong, London, Mumbai, San Antonio, Sydney, & Sao Paulo. Testing from a datacenter closer to where your website’s traffic is primarily coming from is going to give you more relevant information.

The second reason I’d recommend a free account is data retention. Your free account will save up to 2 weeks worth of your tests, meaning you can run a test, take a break, and come back to it later.
Sure, you could always run the report again — but each time you run a report you’re going to end up with slightly different results. Not only will having these retained tests solve that, but it will save you time and resources not having to run the reports over and over again.
I’ll drop in my URL, theadminbar.com, and hit analyze.

After just a few seconds, we’re given an overwhelming amount of data. As I mentioned, I’m only after a few specific things here — so let me point those out.
As I mentioned, I think PageSpeed does a much better job with Core Web Vitals, and since Google doesn’t care about a GTMetrix grade, neither do I.
However, the speed visualization chart just below it, and inside the summary tab can be really helpful.

Here you can see a visual timeline when different events during your page load happend; from first byte to fully loaded.
This is great if you’re trying to narrow down where in this chain things are slowing down.
In this example you can see the first bit of data came back from my server in just 160ms, and from the first pain until the site was fully loaded was just another 200ms.
Further down on this page, I want to highlight the Page Details section, which will show you your total page size along with breaking down sizes by file type, along with total page requests (again, broken down by type).
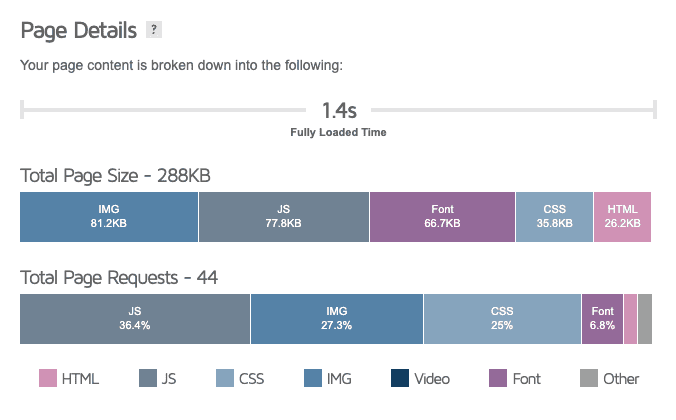
These numbers can be really helpful and give you quick insight into potential problems. For example, in most cases, I’m striving to keep my total page size under 1MB and my total requests under 30 (which you can see I’m not doing on this site).
Of course, that’s going to vary from site to site, depending on what you’re trying to accomplish, but that’s my starting point.
But let’s move to what I think is the most useful part of the GTMetrix report: the waterfall chart.
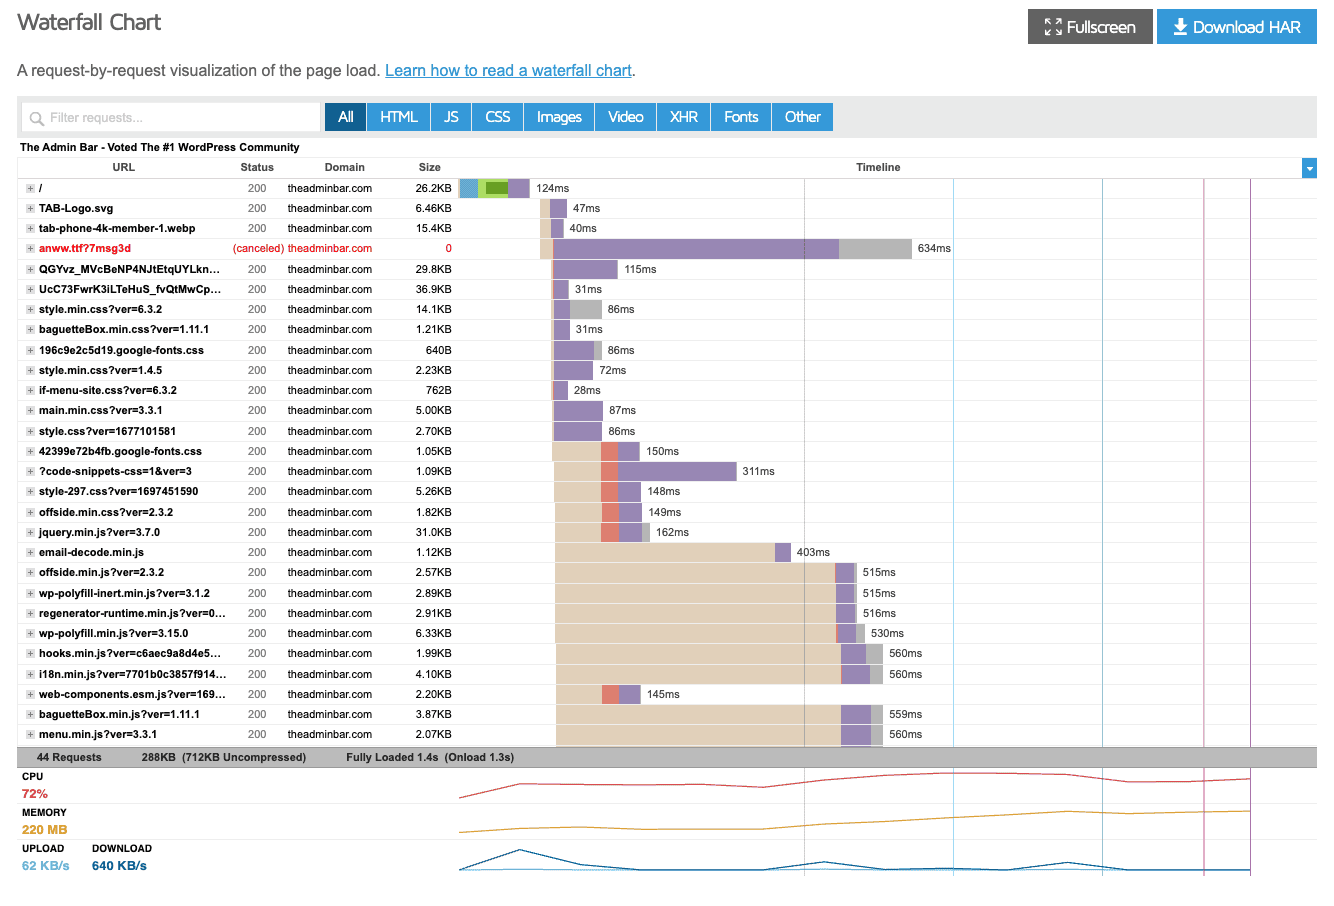
While this may look intimidating, it’s actually white simple.
What you’re seeing here from left to right is a timeline of your website loading.
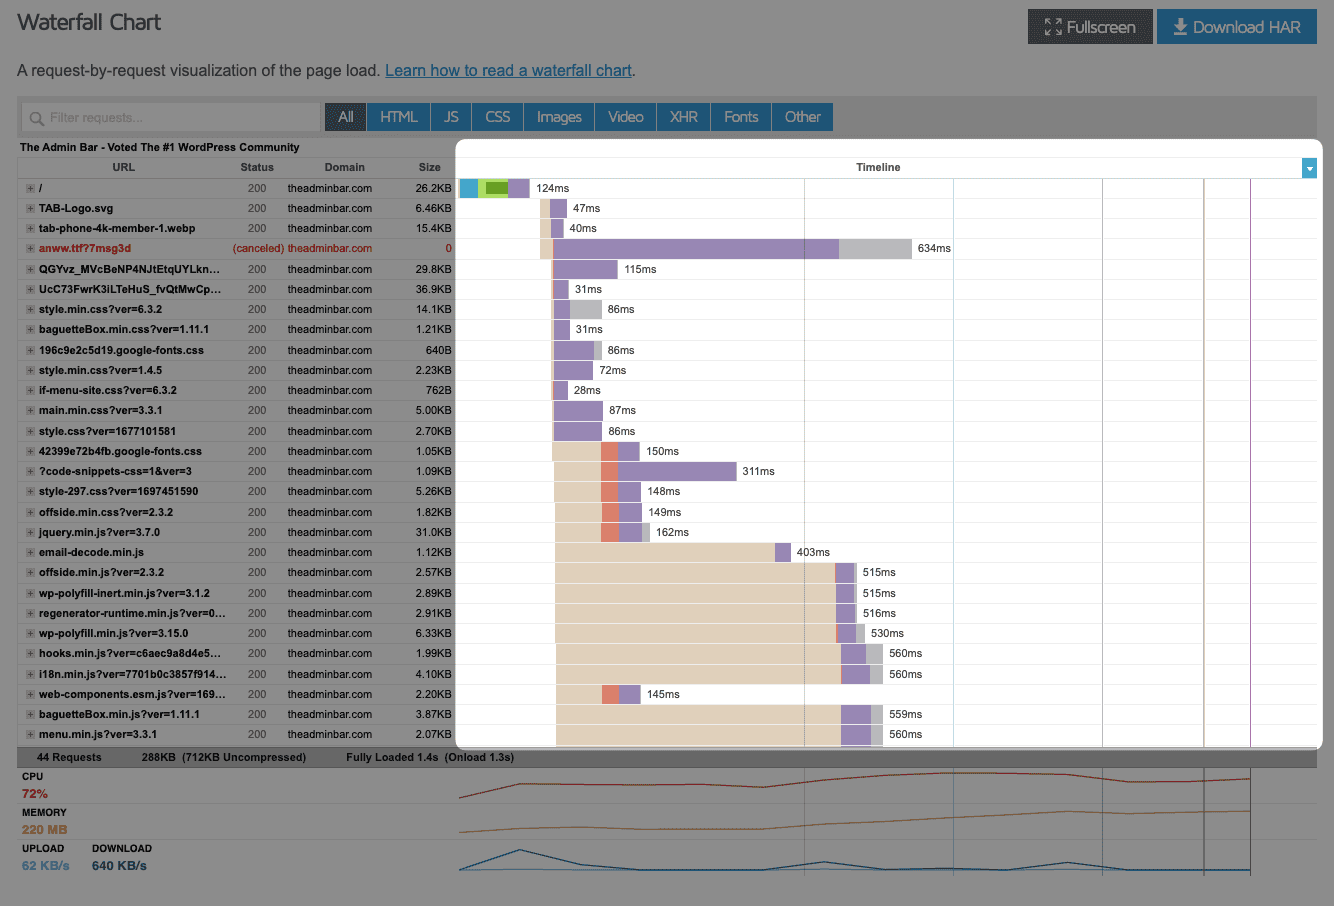
On the other axis is each request. You can see, here at the bottom, I have 44 requests on this page, and this chart lists each of them individually.
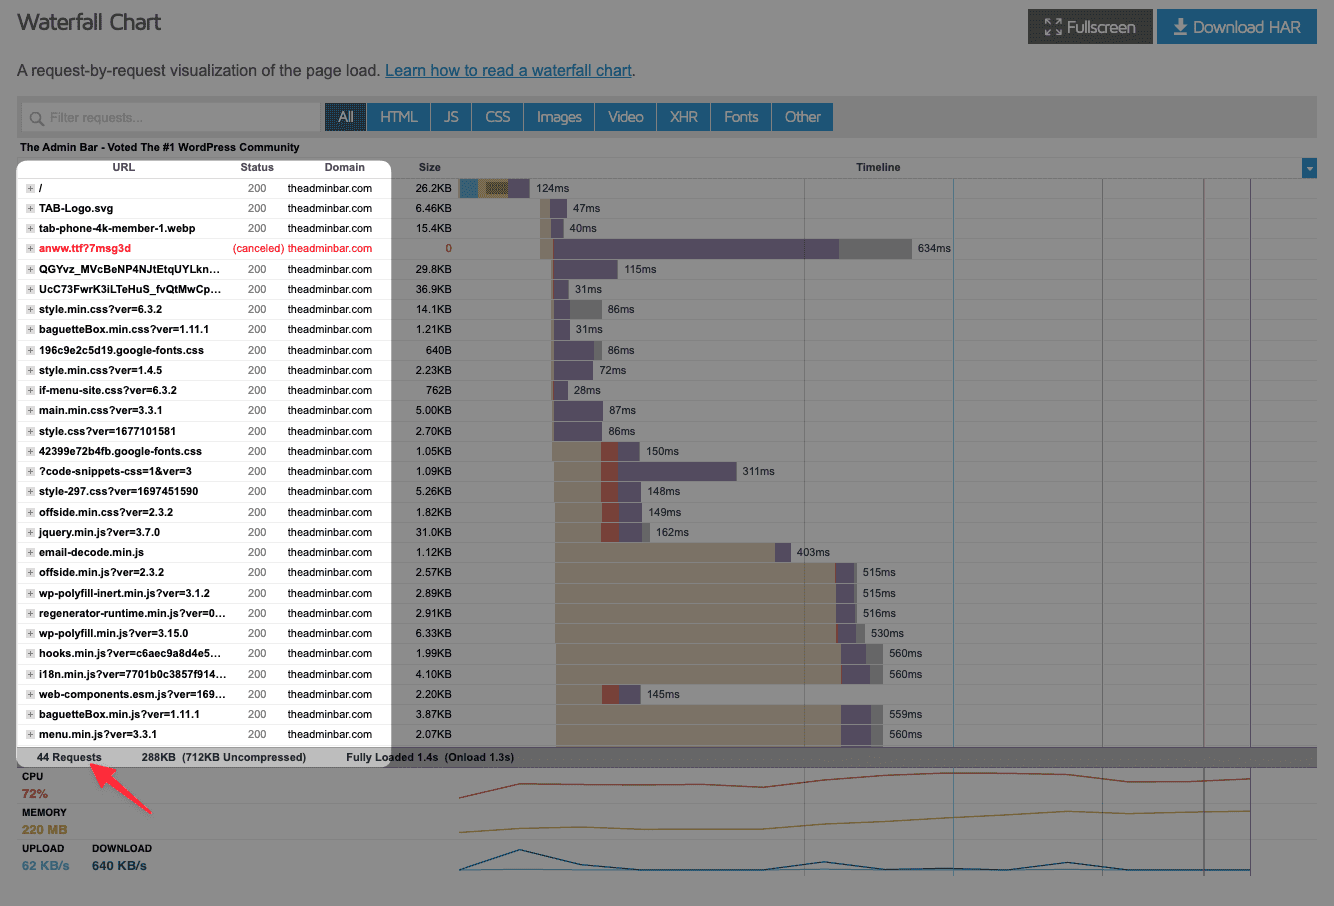
We can see the size of each request, plus how long it took to actually load.
And not only that, we can see how long it takes to look up the DNS, request the information, and how long it takes our server to send it back.
Welcome to performance-nerd heaven!
And as much as it killed me, I actually left this one issue on my website to demonstrate how this information could be helpful.
We can see this one resource that took 438ms to complete, and because it’s in red, I know it actually canceled out. This bar is so long on the timeline alerts me to a possible issue.
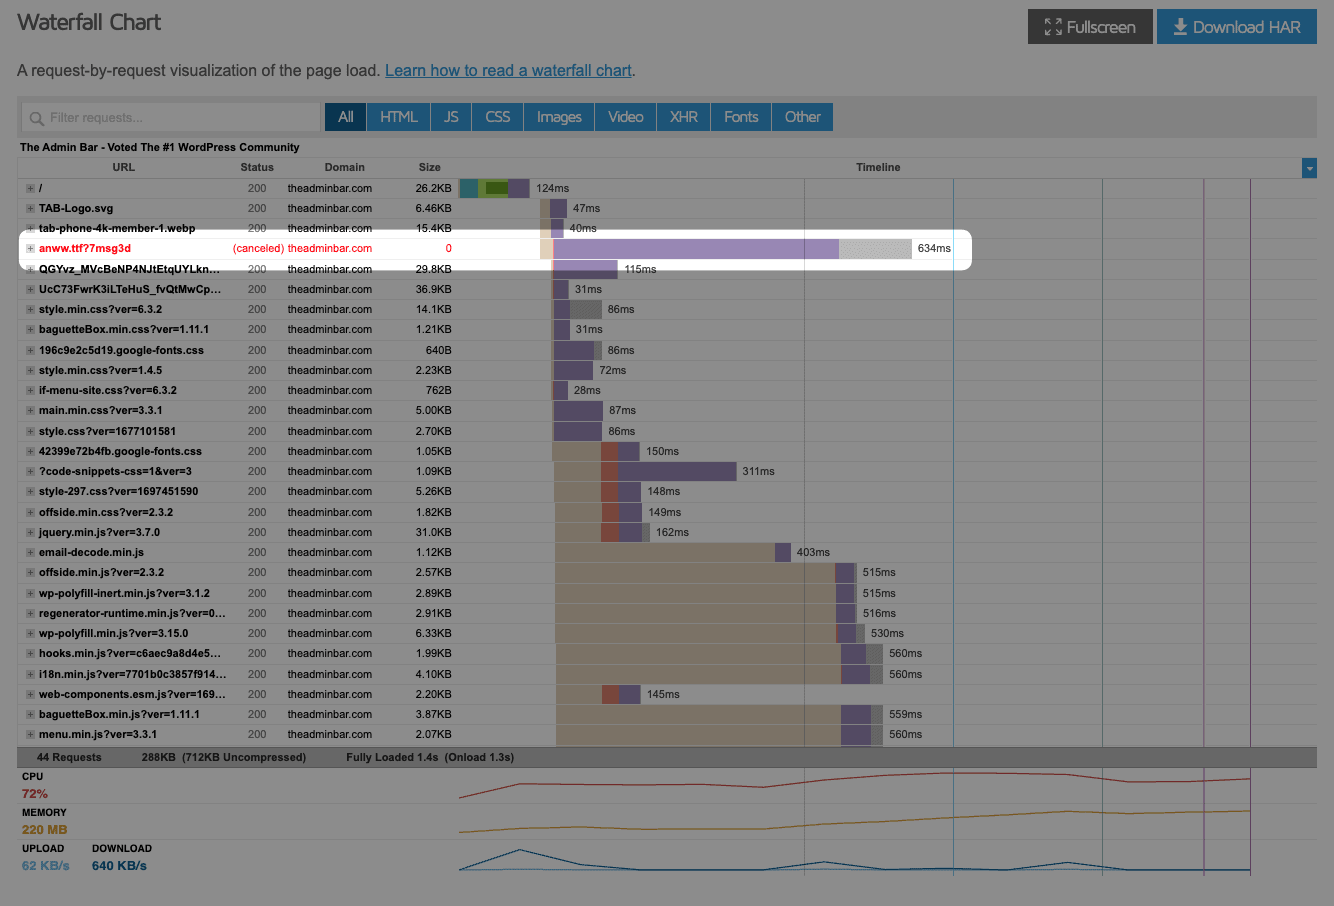
I can click on the plus icon to open up the accordion — each request has more details inside the accordion — to find out more details.
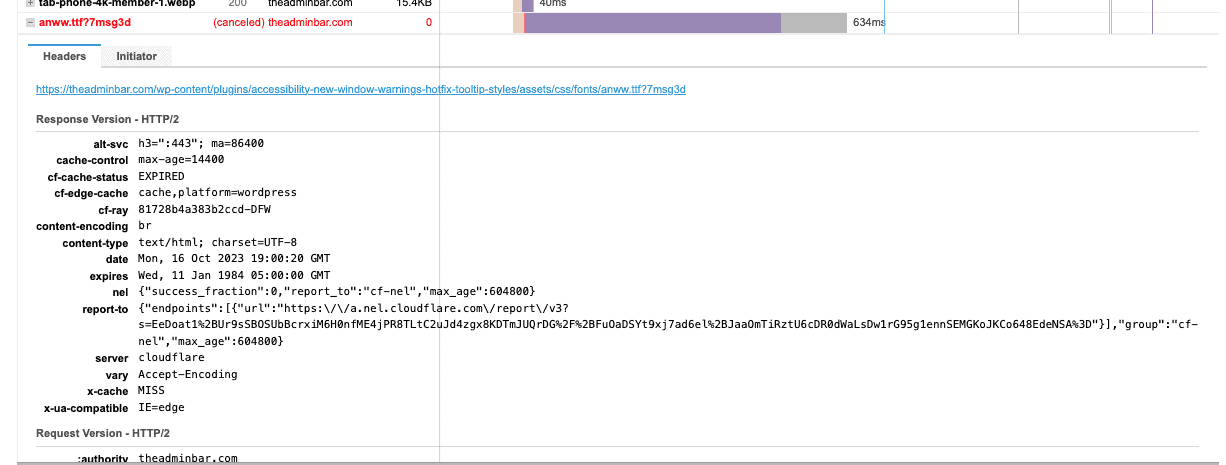
I can find out here that this is actually a font from a plugin that’s not loading. If I can fix this issue, then I know I can save some significant load time.
You can, of course, go through each of these requests one by one, but it’s rare I do that. Instead, I’m looking for outliers to identify potential issues.
This report doesn’t give you all the helpful definitions and links to articles like Lighthouse does, but with a little digging, you can typically figure out what the issue is.
Across the top of the waterfall report, you can filter this down to different request types like JS, CSS, images, video, and fonts, which can also come in handy.
When auditing sites, I’ll often find that it’s poor server response times or broken resources, like my font, that are major culprits of poor scores, and those things are a lot easier to find in the GTMetrix report than they are in PageSpeed Insights.
Conclusion
There is, of course, an even bigger conversation to be had on how to fix all the problems you uncover — a lot of which we’ve covered in videos with Brian Jackson from Perfmatters.
And we could go way deeper than we did today testing things to the nth degree — but as someone who routinely goes down that rabbit hole, I can tell you that a lot of it will give you diminishing returns.
What I shared with you today is a more practical approach that will uncover most issues and at least point you in the right direction.
Hopefully, you learned something new in this article, or maybe you just confirmed what you were already doing.
Either way, I appreciate you joining me.


