If you’ve been keeping up with the latest developments in website performance evaluation, you might have heard about Google’s recent adoption of Lighthouse 10. But what exactly is Lighthouse testing, and why should you care about this update?
In this post, we’ll help you understand what Lighthouse testing is all about, dive into the recent changes introduced in Lighthouse 10, and explore actionable tips to ensure your website continues to excel in the eyes of Google.
Whether you’re a seasoned web developer or just starting to learn about the importance of website performance, this guide will provide valuable insights to help you stay ahead of the curve.
Understanding Lighthouse Testing
Before we dive into the recent Lighthouse 10 update, it’s essential to have a solid grasp of what Lighthouse testing is and why it matters. In this section, we’ll cover the basics of Lighthouse testing, its importance, and the key performance metrics it uses to evaluate your website.
What is Lighthouse testing?
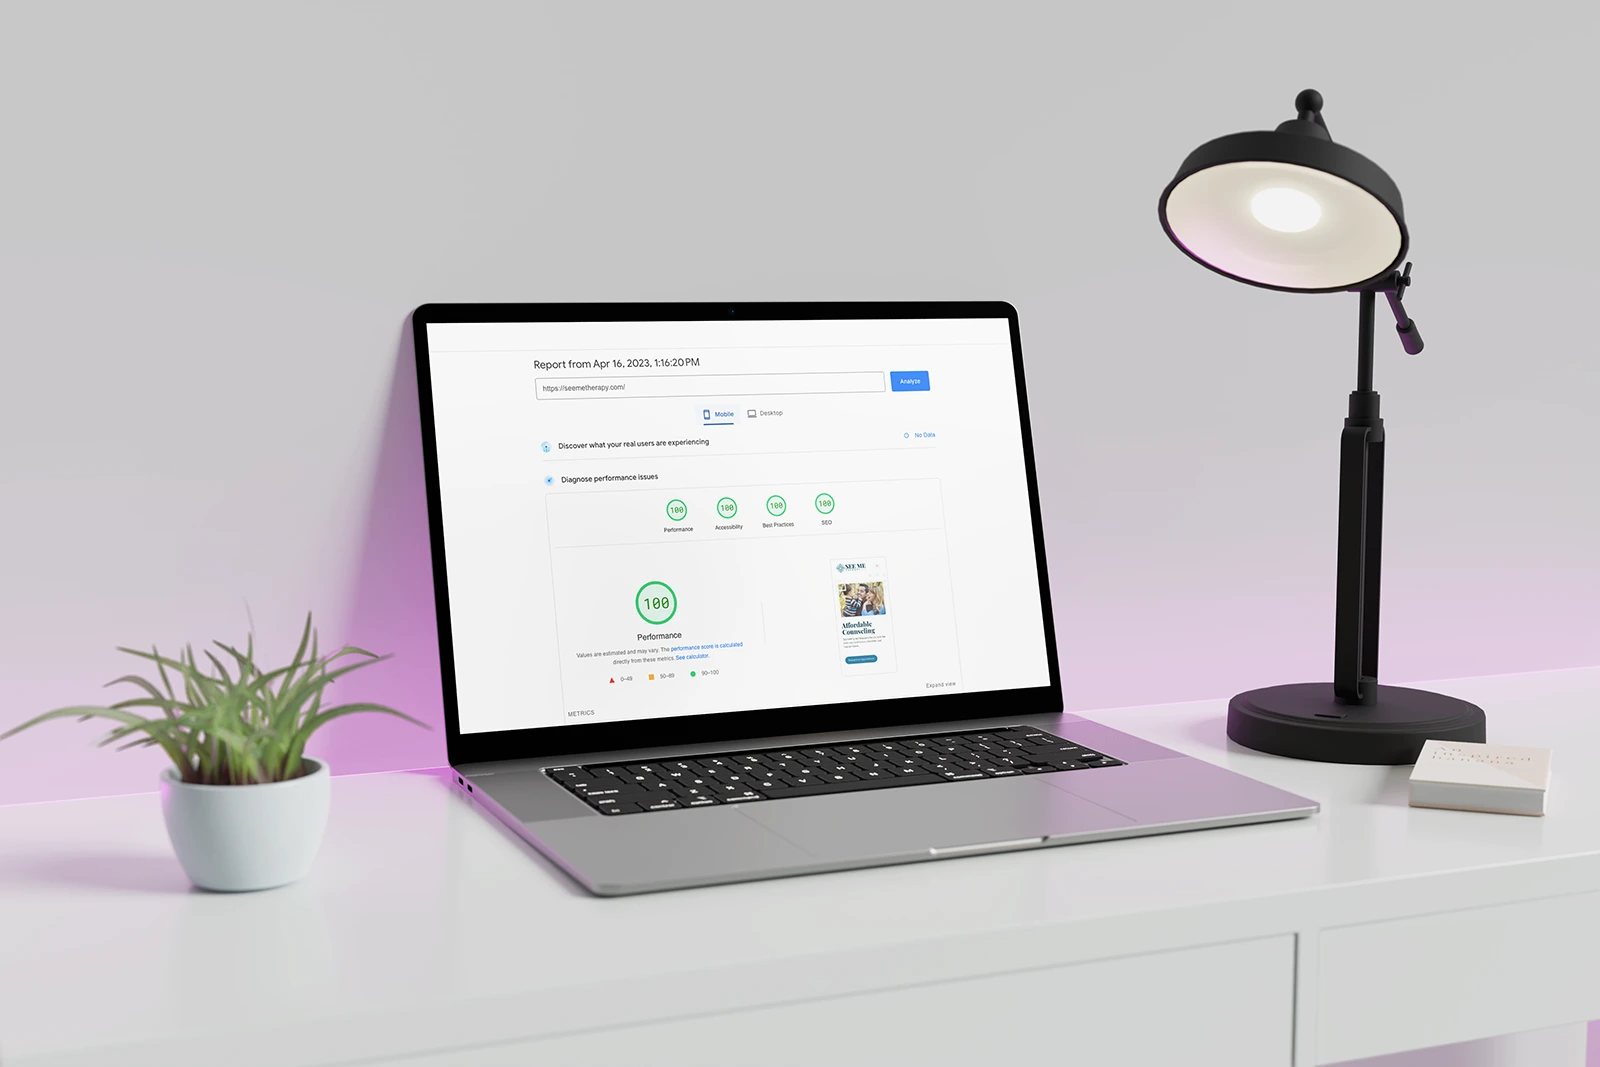
Think of Lighthouse testing as a health checkup for your website. Just like you visit a doctor for a routine check to ensure everything is functioning as it should, Lighthouse testing is an open-source tool developed by Google that assesses and improves your website’s overall performance, accessibility, and user experience.
By running a series of automated tests, Lighthouse provides you with a detailed report that highlights areas where your website excels and suggests specific improvements where needed.
Try testing your website with Litehouse
Why Lighthouse testing is important
So, why should you care about Lighthouse testing?
Your website’s performance plays a huge role in its success.
When users encounter slow-loading or poorly designed websites, they often lose patience and move on to other options.
A site that isn’t up to par could mean losing potential customers and damaging your online reputation.
Plus, search engines like Google factor in website performance when determining search rankings. A better-performing website has a higher chance of ranking well, leading to increased visibility and organic traffic.
By leveraging Lighthouse testing, you can pinpoint areas that need improvement, optimize your website, and stay ahead of your competition.
The key performance metrics used in Lighthouse
Lighthouse evaluates your website based on five main performance metrics. Let’s break them down:
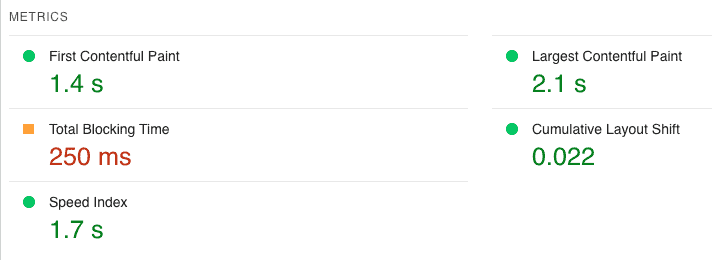
- Largest Contentful Paint (LCP): This metric measures the time it takes for the largest element, like an image or text block, to become visible on the screen. A fast LCP helps ensure users perceive your site as loading quickly.
- First Input Delay (FID): FID measures the time it takes for your website to respond to the user’s first interaction, like clicking a button or link. A low FID ensures users don’t feel frustrated waiting for your site to react.
- Cumulative Layout Shift (CLS): This metric evaluates the stability of your website’s layout during the loading process. A low CLS score means your site’s elements don’t unexpectedly shift around, making for a more enjoyable user experience.
- Time to Interactive (TTI): TTI measures how long it takes for your website to become fully interactive, allowing users to engage with all its features. A short TTI indicates a more responsive website.
- Total Blocking Time (TBT): TBT quantifies the amount of time your website is “blocked” and unable to respond to user input. A lower TBT means your site is more readily available for user interaction.

By understanding these key metrics, you can gain valuable insights into your website’s performance and work on optimizing each aspect for a better user experience and improved search rankings.
Lighthouse 10: What’s New and Different
As with any update, it’s crucial to understand what has changed and how it affects your website’s performance evaluation. If you’ve noticed a change in your performance scores recently, it’s likely due to Google’s switch to Lighthouse 10.
Next, we’ll delve into the differences between Lighthouse 8 and 10, discuss the updated scoring algorithm, and explore the reasons behind these changes.
Lighthouse 8 vs. Lighthouse 10
When comparing Lighthouse 8 and Lighthouse 10, you’ll notice several key differences in the way they evaluate website performance. Some performance metrics have been adjusted, and new recommendations have been introduced to help you optimize your site even further. This shift in focus reflects the ever-evolving landscape of web development and user experience.
By understanding these differences, you can identify areas where your website may need adjustments to stay competitive in terms of performance and user satisfaction. The most significant change in Lighthouse 10 is the updated scoring algorithm. While some core performance metrics and their weights remain the same, others have been adjusted or removed.
Here’s a comparison of the metric weights in Lighthouse 8 and Lighthouse 10:
| Metric | Lighthouse 8 | Lighthouse 10 | Difference |
|---|---|---|---|
| First Contentful Paint (FCP) | 10% | 10% | 0% |
| Speed Index (SI) | 10% | 10% | 0% |
| Largest Contentful Paint (LCP) | 25% | 25% | 0% |
| Time to Interactive (TTI) | 10% | — | -10% |
| Total Blocking Time (TBT) | 30% | 30% | 0% |
| Cumulative Layout Shift (CLS) | 15% | 25% | +10% |
Here are the biggest takeaways from this data:
- Time to Interactive (TTI) has been removed from the Lighthouse 10 scoring algorithm.
- Cumulative Layout Shift (CLS) has seen an increase in weight from 15% in Lighthouse 8 to 25% in Lighthouse 10.
These changes indicate that Google is putting more emphasis on the visual stability of web pages (CLS), while no longer considering the Time to Interactive metric.
Understanding the “Why” Behind the Changes
You might be wondering why these changes were made in the first place. The rationale behind adjusting the scoring algorithm is to align it more closely with real-world user experience.
By increasing the weight of the Cumulative Layout Shift (CLS) metric and removing Time to Interactive (TTI), Lighthouse 10 encourages website owners to prioritize aspects that have a more significant impact on the overall user experience.
In the end, the goal is to help you build a website that performs better, both for your users and in search engine rankings.
It’s essential to understand that these changes are a natural part of keeping your website up-to-date. As technology and user behavior evolve, so do the metrics used to measure website performance.
Search engines, like Google, are always striving to improve user experience, and as a result, they continuously adapt their algorithms and performance metrics to better reflect user expectations and needs.
As a website owner, it’s crucial to stay informed about these changes and be prepared to adapt your site accordingly. Regularly monitoring your site’s performance and keeping an eye on industry updates will ensure that your website remains competitive and optimized for both search engines and users.
Embracing these changes and adapting to the evolving internet landscape is vital for maintaining a high-quality website that meets the needs of your audience.
Boosting Your Performance Score in Lighthouse 10
Now that you’re familiar with the changes in Lighthouse 10, it’s time to focus on what you can do to improve your website’s performance score. Prioritizing the right metrics and making adjustments to your website will help you stay ahead of the competition and provide a seamless experience for your users.
Focus on Cumulative Layout Shift (CLS)
Since the weight of CLS has increased from 15% to 25% in Lighthouse 10, it’s crucial to pay attention to this metric. CLS measures the visual stability of a webpage, and a high CLS score indicates that elements on the page are shifting unexpectedly, leading to a frustrating user experience.
To improve your CLS score, consider the following:
- Use dimensions for images and video elements to prevent content from shifting as they load.
- Avoid inserting content above existing content, especially if the user is currently interacting with the page.
- Optimize web fonts by using
font-displayCSS property to control how fonts are rendered.
This all sounds great in theory, but what does it actually mean?
Here are some things that commonly affect your CLS:
- Images without dimensions: When images on your website don’t have specified width and height attributes, the browser won’t know how much space to allocate for them until they load. This can cause other elements on the page to shift as the image loads, affecting your CLS score. To fix this issue, always include width and height attributes for your images.
- Ads and embeds without reserved space: When ads, iframes, or embedded content are inserted into a webpage without a predefined container size, they can cause surrounding content to shift as they load. To avoid this, reserve space for these elements using CSS, so the content won’t shift when the ad or embedded content loads.
- Dynamic content insertion: If you’re inserting dynamic content, such as notifications or banners, above existing content on the page without reserving space for it, the existing content will be pushed down when the dynamic content loads. This can cause layout shifts that negatively impact your CLS score. To resolve this, reserve space for dynamic content, or place it in a way that doesn’t cause shifts in the layout (e.g., displaying it as an overlay).
- Web fonts causing a flash of unstyled text (FOUT): When web fonts load slowly, users may initially see a fallback font, which can cause the text to shift when the web font eventually loads. To minimize this issue, consider using the
font-displayCSS property with a value like ‘swap’ or ‘optional’, which allows the browser to use a fallback font until the web font is available. - Animations and transitions: Certain animations and transitions, especially those that affect the position or size of elements, can cause layout shifts. To prevent this, make sure your animations and transitions don’t change the overall layout or dimensions of elements on the page. You can use CSS properties like
transformoropacityto create animations that don’t impact the layout.
By addressing these specific issues, you’ll be able to reduce layout shifts on your website and improve your CLS score in Lighthouse 10.
Optimize Largest Contentful Paint (LCP)
Even though the weight of LCP hasn’t changed, it’s still an essential metric for measuring the perceived loading speed of your webpage. LCP represents the time it takes for the largest content element (e.g., an image or text block) to become visible on the screen.
To optimize LCP, you can:
- Optimize and compress images to reduce their file size without compromising quality.
- Use lazy loading for offscreen images, so they don’t compete with onscreen content for resources.
- Minify and compress your CSS and JavaScript files to reduce their size and improve load times
Address Total Blocking Time (TBT)
TBT remains an important metric in Lighthouse 10, as it measures how long a page is unresponsive due to JavaScript tasks. Users may experience delays in interaction if TBT is too high.
To reduce TBT, consider:
- Breaking down long tasks into smaller, asynchronous tasks that allow the browser to stay responsive.
- Removing or deferring non-critical JavaScript, so it doesn’t block the main thread.
- Using code splitting to load only the necessary JavaScript for each page or route.
By focusing on these key metrics and making the necessary adjustments, you’ll ensure that your website is prepared for the Lighthouse 10 update. Regularly monitoring your site’s performance and making optimizations will help you maintain a high-quality website that delivers an outstanding user experience and keeps you ahead in search engine rankings.
Ready, Set, Optimize: Seize the Lighthouse 10 Opportunity
As we’ve explored in this post, Google’s transition to Lighthouse 10 brings some crucial changes that can impact your website’s performance score. By understanding the updated metrics and their significance, you’re better prepared to tackle these changes head-on.
Remember, focusing on key metrics such as Cumulative Layout Shift (CLS), Largest Contentful Paint (LCP), and Total Blocking Time (TBT) will help you optimize your site for the Lighthouse 10 era. Taking the time to address these factors will ensure that your website continues to deliver a stellar user experience and stays ahead in search engine rankings.
If you’re feeling overwhelmed or need expert guidance to navigate these changes, don’t hesitate to reach out for assistance. At OGAL Web Design, we’re here to help you optimize your site and make sure it shines in the Lighthouse 10 landscape. Contact us today, and let’s work together to turn these challenges into opportunities for growth.


